


Understanding Maps
Section 1: Understanding Lines on a Map
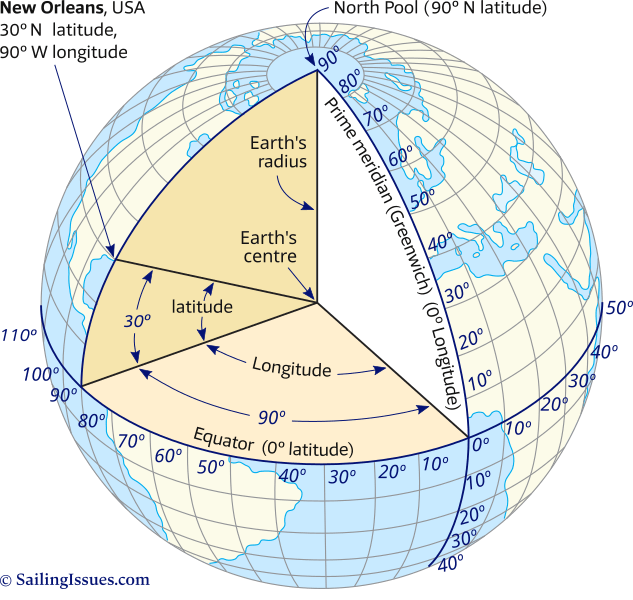
In this next section, we are going to be reviewing our knowledge of maps and then using that knowledge to explore the world. There are many different types of maps that we will use in this class. Let's get some vocabulary out of the way. You should know that the equator is an imaginary line that circles the Earth exactly halfway between the north and south poles. This line is considered to be located at 0° latitude. The north and south poles are at 90º. North of the equator is called the northern hemisphere and south of the equator is referred to as the southern hemisphere. The lines that run parallel to the equator are called latitude or latitudinal lines. Each line of latitude is a specific degree either north or south of the equator.
There is another imaginary line that represents 0º longitude, called the Prime Meridian. Longitudinal lines are parallel to the prime meridian and each line is a specific degree away from the prime meridian. The prime meridian is different than the equator in that it only circles half the Earth. West of the prime meridian we have degrees 0-180 and East of the prime meridian has another 0-180 degrees. The Prime Meridian runs through the Greenwich Observatory near London.
Understanding the latitude and longitude can help you pinpoint the location on globes and maps.
|
|
|

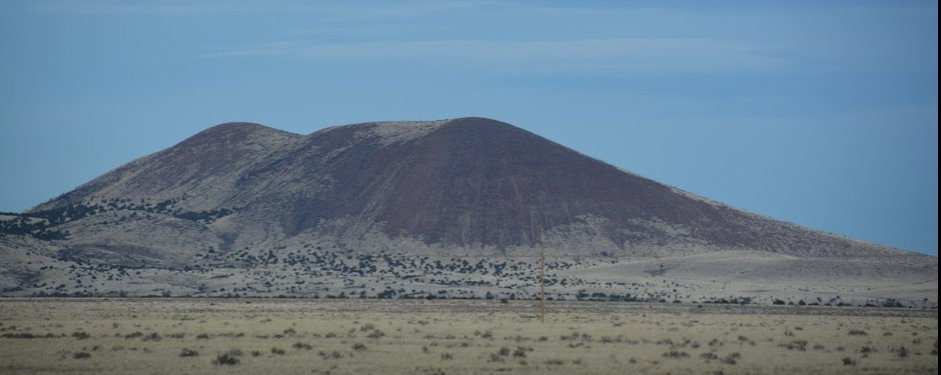
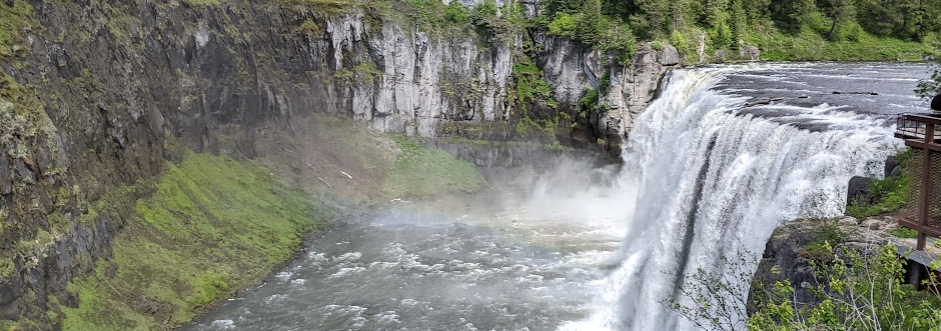
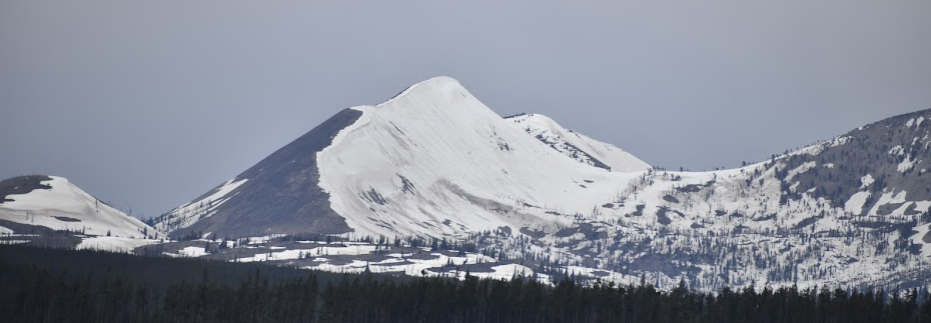
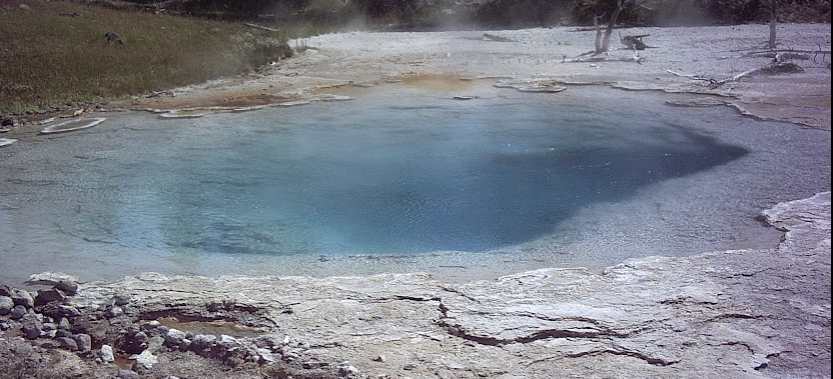
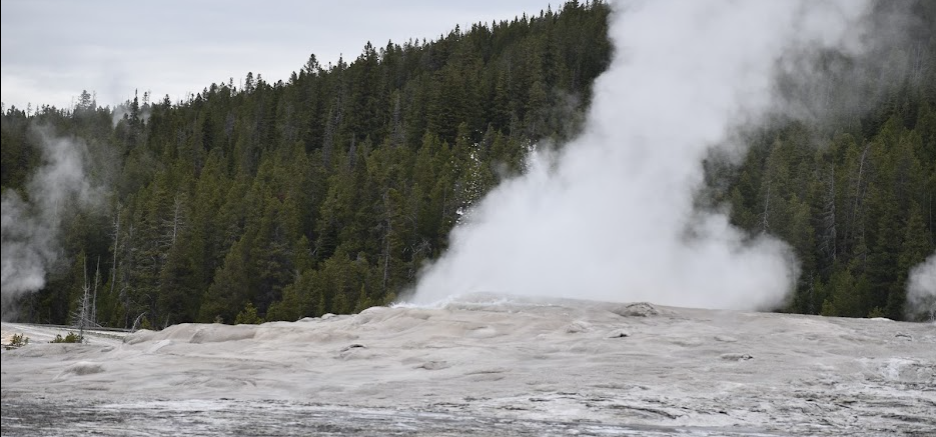
To practice this you are going to use Google Earth to locate awesome landforms, landscapes, and locations around the Earth.
If you are a student at Holbrook, Heber, or Snowflake click SUSD5 version of Coordinates of Awesome Geology
Purchase this activity at Teachers Pay Teacher for $1.00.
Watch a presentation on some of the coordinates found during this assignment. Learn some of the geology behind the formations.
Section 2: Understanding Time Zones and Topographic Maps
Now, if you didn't already know this, the Earth rotates around its axis every 24 hours and we call this a day. Also when half the Earth faces the sun and is light outside, the other half of the Earth faces away from the sun and is in darkness. The Earth has been divided into 24 different time zones which are 15 degrees wide. In the United States, we have 6 of those time zones. An important note is that these time zones are not straight lines. They zig and zag as they try to keep specific cities and regions in the same time zone.
As you can see from the time zone map below, click it to enlarge it, and you can see that each time zone is given a number. This is called UTC (Universal Time Coordinated). Scientists use UTC when giving a time that something occurred, like an earthquake. If they were to say 7:00 PM, what would that actually mean? If it is 7:00 PM in Arizona, people in other time zones would have a different time. So if an earthquake occurs at 7:00 PM UTC, that would actually be at noon Arizona time, because we are in a UTC -7 time zone. Tell a partner what time it would be for the following UTC times in AZ: 5:00 AM, 10:00 PM, 1330, 1700.

Another piece of information you will need to know is that there is another imaginary line called the International Date Line. It is found at 180 degrees from the Prime Meridian or on the other side of the globe from the Prime Meridian. This is a transition line between days. If you cross it going to the west, you are on one date, and if you cross back over the line going east you actually lose a day or go back in time. So far this is the only way we know how to time travel. This line is also not straight, it zig-zags across the Pacific Ocean. You can see this in the image below. Click to enlarge.

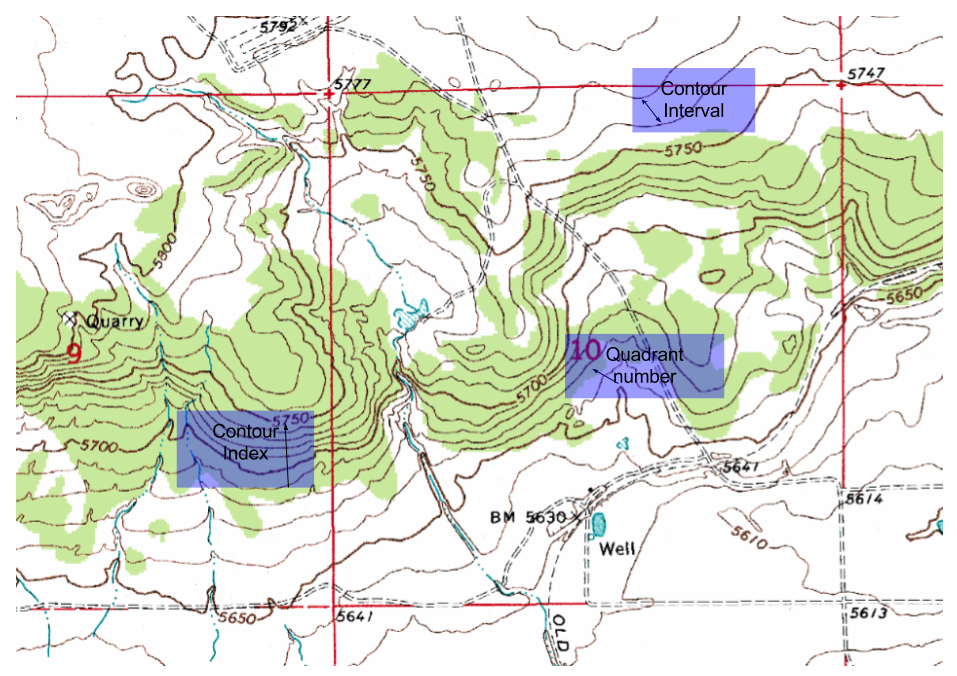
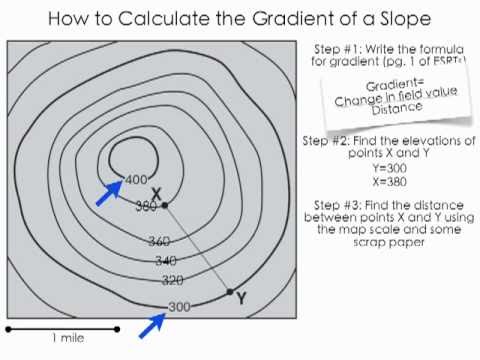
The coolest types of maps are topographic maps. These show changes in elevation. Using these types of maps can show you how steep natural features such as mountains, hills, plains, lakes, and rivers; and can even show you cultural features like roads, cities, and dams. Many times when reading and talking about topographic maps you will hear the word gradient. A gradient is nothing more than the slope of a mountain, hill, or road. You have heard of the word slope in Algebra multiple times. On a topographic map, the gradient is talking about the Algebraic calculations, rise overrun.
|
A few other vocabulary words that will help you understand topographic maps are:
To calculate the gradient all you need to do is subtract 1 contour index from another and then use the map scale to find the distance from one index to another. Divide the difference by the distance.
|
|


Let's practice and gain a better understanding of the purpose of using topographic maps.
Click here if you are a student at Snowflake, Holbrook, or Heber. SUSD5 Version of Contour Map Exercise.
You can purchase this activity at Teachers Pay Teachers for $0.50 cents.
Section 3: Understanding Geologic Maps
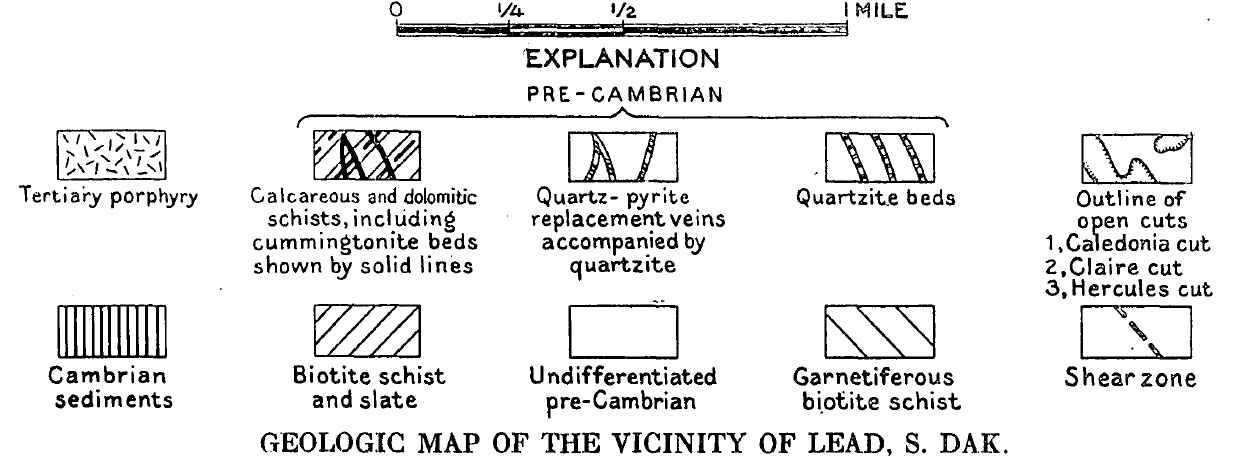
This last section is going to introduce you to geologic maps. These types of maps are specialized and show geological features like rock units, bedding planes, faults, folds, foliations, and ages of rocks. The map below is an example of what a geologic map looks like. Each color represents a different set of rocks and ages. The map legends are very descriptive and give a bunch of cool information.
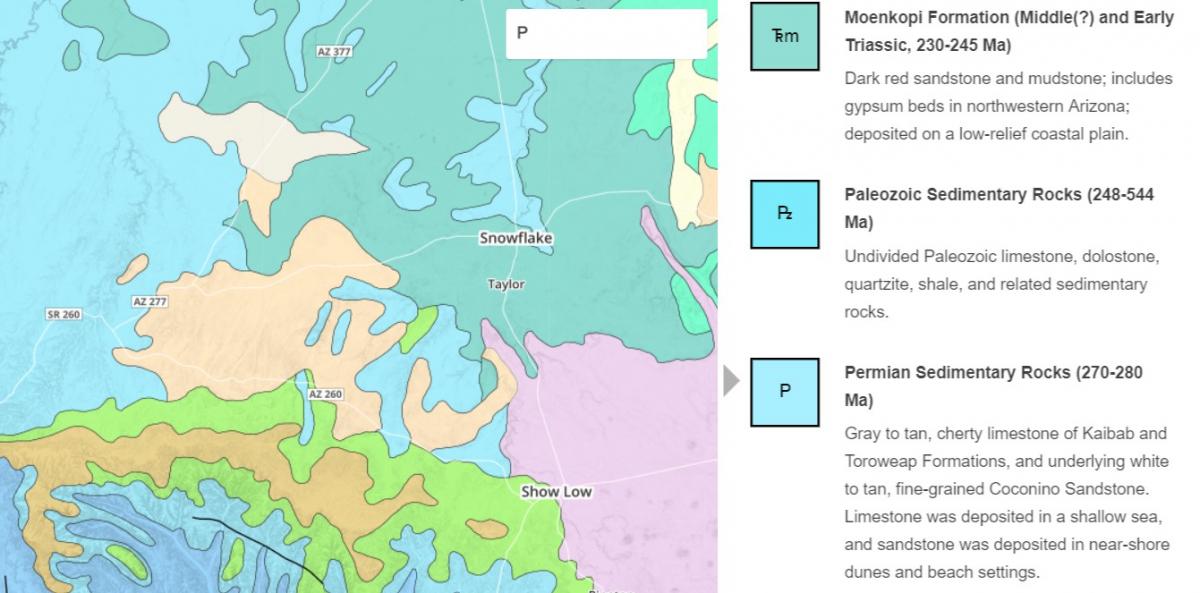
Let's play with Arizona's geologic map and discover what a person would see as they drive from Snowflake AZ to Phoenix AZ. After playing with this map your drive to Phoenix will be much more enjoyable.
Click here if you are a student at Snowflake, Holbrook, or Heber. SUSD5 student version of Interactive Geologic Map Exercise. If this version is not working, use this version which contains a detailed PDF of a Geologic Map
You can purchase this activity at Teachers Pay Teachers for $1.00. (It contains both versions of the activity)