

Understanding Earthquakes Hands-On and Digital Based Assignment
Understanding Earthquakes Hands-On and Digital Based Assignment
In this Earth Science assignment students will gain a better understanding of what an earthquake is, the power that is released, how to locate the epicenter, and read seismograms by understanding P and S waves. To wet their appetite for what is coming I show a newscast about the 2011 Japanese earthquake that generated a deadly tsunami. I introduce this lesson by telling students that they need to use their imagination. They are going to pretend that they are seismologists and that there was a recent earthquake that just occurred. After setting up the scenario, they are going to describe what seismologist is, seismograph, seismogram and epicenter. I show a USGS video made that does a pretty good job of describing these vocabulary terms.
I have my student login to their machines at this point and create a spreadsheet. The spreadsheet is going to calculate the distance away from the epicenter each of the seismograph stations are located. I believe in teaching my students how to use technology when solving problems and felt this would be a great time to reinforce that power behind spreadsheets.
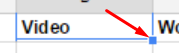
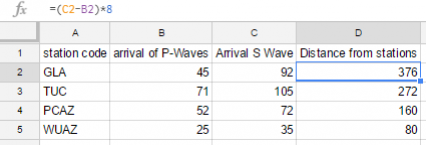
After students initially set up their spreadsheet we discuss what P, S and Surface Waves are and how they are used to tell what type of material is found below the surface. We also discuss how seismic waves move through the earth using animations. During the discussion it comes up that calculating earthquake wave distances, we can take the difference between arrival times of p and s waves, because we know that s waves travel about 8km/s . Once the p wave hits we know that every second it takes for the s wave to arrive it was 8 km away. This is where I teach students to convert the formula epicenter distance is equal to the (p-wave minus the s-wave) times 8. I let my students try to figure out how to take that formula and then convert it into a formula that the spreadsheet can understand. They already know that a cell is just a variable for what is in that cell. The formula comes out to something like this depending on where they start their spreadsheet data: =(c2-b2)*8 . I also teach them that they don't have to write the formula for each cell but rather use the copy tool. Just click on the bottom right square and drag it down and it will set up the formula for every cell that follows. Now when students enter their data from their seismograms it should tell them about how far the earthquake's epicenter is.
The next section of the assignment is to teach students how to read a seismogram. Students can locate the P and S waves by know that a P wave make the first large "bump" on the seismograph and then the S-wave make the next large "bump." They will use rulers as straight edges so that they can see how many seconds the seismograph was reading when each wave hit. After looking at the 4 seismograms in the assignment students should notice a huge difference in seismic amplitude.
Once they have the information recorded and calculated into their spreadsheet students will use compasses to triangulate the epicenter. There are 4 seismic readings and if all things were done to perfection the circles drawn by their compasses would all meet somewhere, giving the exact epicenter location. There is some estimation involved in reading the seismograms so their locations will be slightly off. You can see a well drawn one below and they don't all match. I have my students place dots where circles intersect and then do their best to place a dot in the center of all the other dots. For our purposes this will work fine. I do let students know that on a real seismic reading scientists can zoom in and know exactly when each earthquake wave hits. There isn't much estimation and it is pretty exact with the proper equipment.
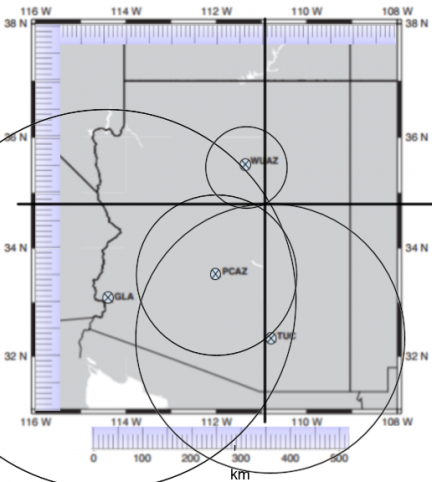
Students will now use rulers as straight edges again to find a coordinate. Once they have a coordinate they go to Google Earth and locate the actual place in Arizona. It should be fairly close to a famous Arizona landmark, but anyplace will work as long as they are close to where the triangulation hits.
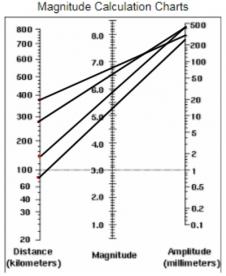
When students know the distance from an epicenter to a seismograph station, they can use a magnitude chart to figure out how large an earthquake was. Students will plot the distance from the epicenter of each seismograph station and then look at each seismogram, find the highest amplitude, and then plot it on the magnitude chart. They will then connect the dots and wherever that lines cross represent the magnitude that the seismograph station felt. One of the questions in the assignment is to discuss with their groups why each station recorded a different magnitude. Some of the answers should be: Each station is located in a different area, surrounded by different rock. The seismic waves traveled different distances through that rock. Human error; students should recognize that we lack the proper equipment and computer models to accurately plot the epicenter. I have my students come up with an exact magnitude by having them calculate the average of all four magnitudes.
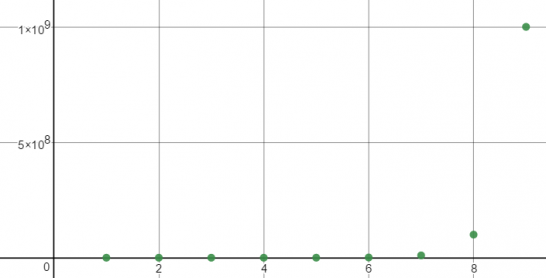
Overall this assignments was an attempt to include other subjects like language arts and math, so the next section is for students to understand the logarithmic and exponential ideas behind the power and energy released from an earthquake. Students will mathematically compare the energy released by different magnitudes. An example would be a 5.0 magnitude compared to a 1.0 magnitude. The students will work with exponents, including exponents with decimals. One of the concepts that students will get out of this is that the power of an earthquake increases very quickly and that a 9.0 is really, really, really big compared to a 1.0 magnitude and to be honest even an 8.0 is much much smaller than a 9.0. I demonstrate to students why a logarithmic scale is most likely used instead of a exponential scale. To help visualize this I created a Desmos graph and you can see that in order to get a 9.0 on the chart, that we had to zoom out so far that most of the magnitudes appear to form a straight line.
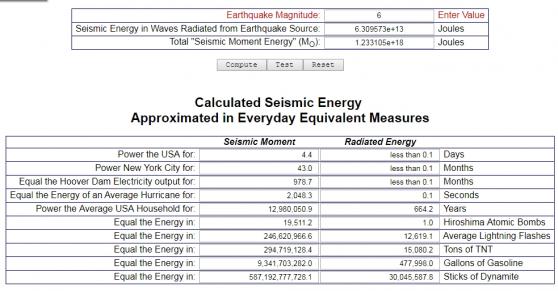
To help the idea sink in even further, I have students go to http://earthalabama.com/energy.html, and use the energy calculator to compare the different magnitudes to the energy of dynamite. Students plug in magnitude variables and it calculates how many sticks of dynamite it would equal. As a class I also discuss what that is equal to in terms of the power generated if it could be harnessed.
Students will then read a portion of the assignment that talks about the 2011 Japanese earthquake. They will see that some earthquakes are so powerful that they can move an entire large island and even change time itself. Students will learn that earthquakes are usually followed by aftershocks, which some of them are only one magnitude lower than the original, which means that the 9.0 that was generated, generated 8.0 aftershocks, which are very dangerous earthquakes themselves.
In another attempt to incorporate math, I have students calculate how many years it would take for the Earth to lose a day, due to the millionth of a second lost due to the Japan earthquake.
At the very end of the assignment, students will create a short press release, based on all of the data gathered during this assignment. They will state the location of the epicenter, the time that it occurred, any damage it might have caused, and the magnitude of the earthquake, which they will present to the class.
After the self guided lesson is over I use the images and discussion about seismic waves found here. The lesson overall takes about 3 to 4 days, depending on school interruptions and student participation.
You can purchase the Understanding Earthquakes lesson documents at Teachers Pay Teacher for $1.00. I find the lesson engaging and multicurricular. Many of the questions in the lesson should bring about some pretty good discussions and ah ha moments.